C7 — Multi-Model AI System for Financial Market Analysis
An end-to-end AI ecosystem that runs several specialized machine-learning models on financial and macroeconomic data, measures where their signals converge or diverge, and passes the result through an LLM supervisory and synthesis layer that produces a risk-aware, explained analysis delivered through a web dashboard.
- Context
- Personal project · Source private
- Role
- Mono-repo design, architecture, implementation and deployment
- Timeline
- january 2025
- Stack
- Python · Pandas · NumPy · scikit-learn · XGBoost · LightGBM · Random Forest · n8n · JavaScript · JSON · PHP / MySQL · Linux / Ubuntu · VPS
01 — Overview
Overview
C7 is an end-to-end AI system for financial market analysis. Instead of relying on a single predictive model, it runs several specialized models — each answering a narrower question — and makes the relationship between their outputs explicit before any final analysis is produced.
The system combines predictive machine learning, automated orchestration, a generative-AI synthesis layer, financial and macroeconomic data, and the infrastructure needed to deliver the result through a web dashboard.
The source code is private. This case study describes the architecture and outcomes without exposing proprietary implementation details.
02 — Problem
Problem
A single model trained for one task — for example, relative return prediction — says little about the macroeconomic regime or risk environment in which its output should be read. C7 explores a different structure: several specialized models whose agreement and disagreement are measured explicitly, then interpreted with that context in mind.
03 — Architecture
Architecture
- User
- Web interface
- Backend
- n8n orchestrationWorkflow automation
- Financial / macro data
Specialized ML models
- Relative return
- Macro regime
- Sentiment / risk regime
- Volatility / risk
- Individual signals
- Convergence / divergence analysisAgreement between models
- LLM supervisory & synthesis layerConsistency · risk · explanation
- Backend
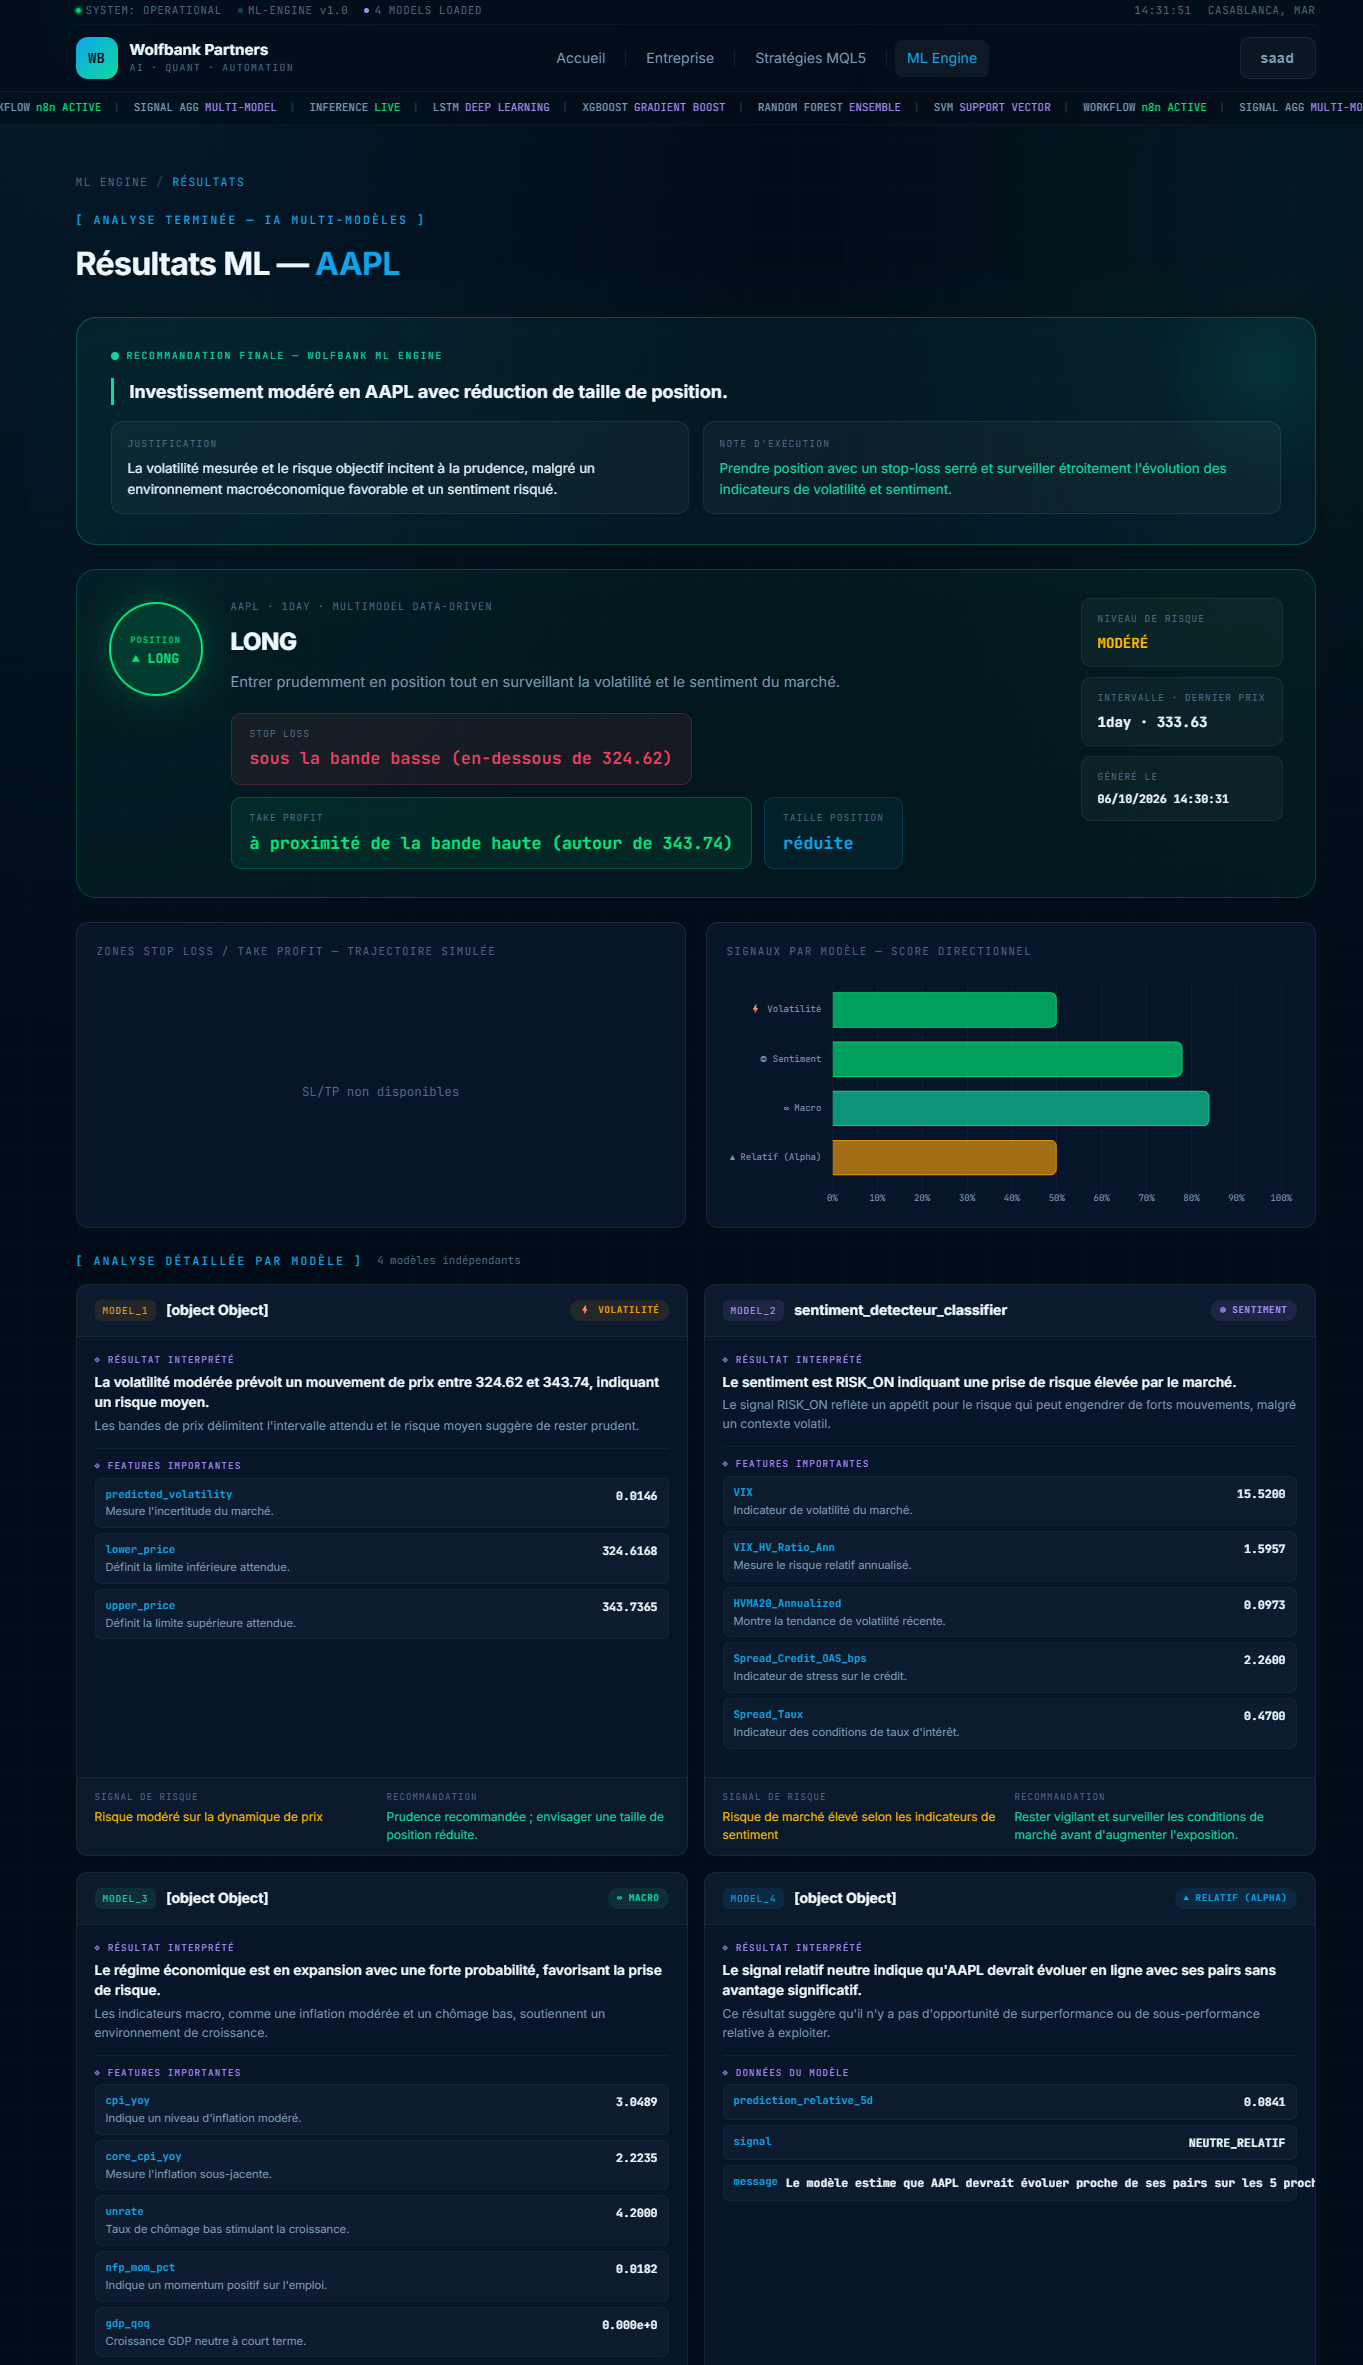
- Dashboard + final analysis
- 01DeliveryA PHP / MySQL web layer serves the interface and backend, hosted on a Linux (Ubuntu) VPS.
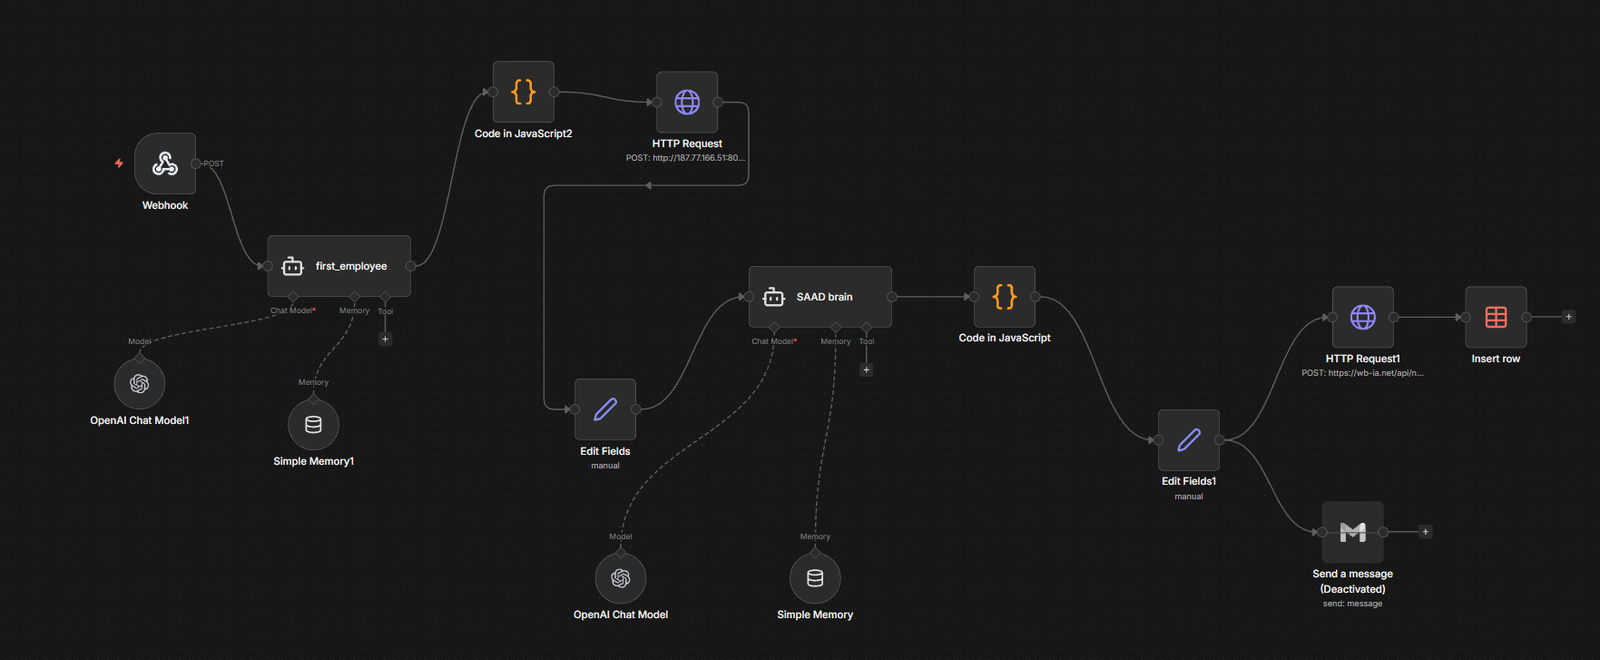
- 02Orchestrationn8n workflows coordinate data collection, model execution and the hand-off between components, exchanging structured JSON.
- 03ModelsSpecialized models produce individual signals for return, macro regime, sentiment / risk regime and volatility / risk.
- 04ConvergenceA convergence / divergence analysis summarizes how far the individual signals agree with each other.
- 05SynthesisAn LLM-based supervisory and synthesis layer performs cross-model consistency analysis, risk-aware interpretation and explanation.
The convergence / divergence indicator measures agreement between models. It is not a measure of market truth and does not guarantee the reliability of any prediction. The LLM layer interprets and explains model outputs; it does not validate their mathematical correctness.
04 — Data / Inputs
Data / Inputs
The models consume financial-market and macroeconomic variables.
Data used withing the models are : macro-economic indicators provided by FRED and financial market data like VIX , US02Y,US10Y,SP500,pair stocks are generated by twelve-data
05 — Methodology
Methodology
Each model is trained and evaluated independently with metrics appropriate to its task. Model families used across the system include gradient-boosted trees (XGBoost, LightGBM) and Random Forests, built with scikit-learn, Pandas and NumPy.
| Model | Task type | Evaluation metric |
|---|---|---|
| Relative return prediction | predict relative return compared with other concurrent stocks | alpha = 0.07 |
| Macroeconomic regime classification | Classification | precision = 0.80 |
| Market sentiment / risk regime | Classification | Accuracy = 0.75 |
| Volatility / risk modeling | Prediction of volatility to estimate risk | RMSE = 0.12 |
the process used in validation was a time-series-cross-validation (walk-forward) approach
06 — Engineering Implementation
Engineering Implementation
- Python data and modeling stack: Pandas, NumPy, scikit-learn, XGBoost, LightGBM.
- n8n for workflow orchestration, with JavaScript and JSON for data transformation between steps.
- PHP / MySQL web layer for the backend and dashboard.
- Self-managed Linux (Ubuntu) VPS infrastructure.
deployment was in a VPS connected to the orchestre n8n to ensure the 24/7 availability and the exceptions was handled by a supervisor LLM to ensure the workflow accuracy.
07 — Results
Results
Workflow results demonstrate successful integration of the AI assistants with the web platform.
08 — Challenges & Trade-offs
Challenges & Trade-offs
the real challenge was in finding ideas and mathematical relationships between indicators like inflation and jobs and also ensure that the workflow is running 24/7 and the models are producing accurate results and also the LLM is able to supervise the workflow and ensure that the results are consistent and reliable.
09 — What I Learned
What I Learned
the real edge is not in evaluation metrics but in the data collected and the power is combining different approaches of analysis with risk estimation to give better insights.
10 — Resources
Resources
Source code is private and not available for review.
For more information, please contact me.